The Average Directional Index (ADX), developed by Welles Wilder, measures the strength of the current trend, and determines the direction of the market, if any. A strong trend is indicated by a rising ADX, whereas a consolidating, or sideways, market is evident with a falling ADX. Note that the ADX does not indicate whether the market is trending up or down.
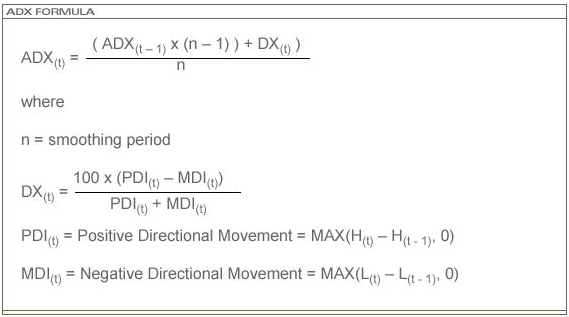
The formula for the ADX (modified Moving Average of DX) is:

The ADX is a lower technical study. ProSticks uses a default parameter value of 14 bars to calculate the ADX. 5 bars is also commonly used.
The ADX is a derivative of the Directional Movement Index (DMI). First, the largest part of the current period’s high or low that is outside of the previous period’s high or low range is calculated. Then, the largest part of the current range above the previous range is taken as PDI. Conversely, the largest part of the current range below the previous range results in the value for MDI. The range increment is the current period’s True Range. The Directional Movement is then divided by the True Range to make the Directional Movement relative to the True Range.
Readings for the ADX usually range between 20 and 40. Readings above 20 and rising indicate a trending market while readings below it indicate a consolidating market. Moreover, readings above 40 and falling tend to suggest that the market’s prevailing trend is losing strength.

