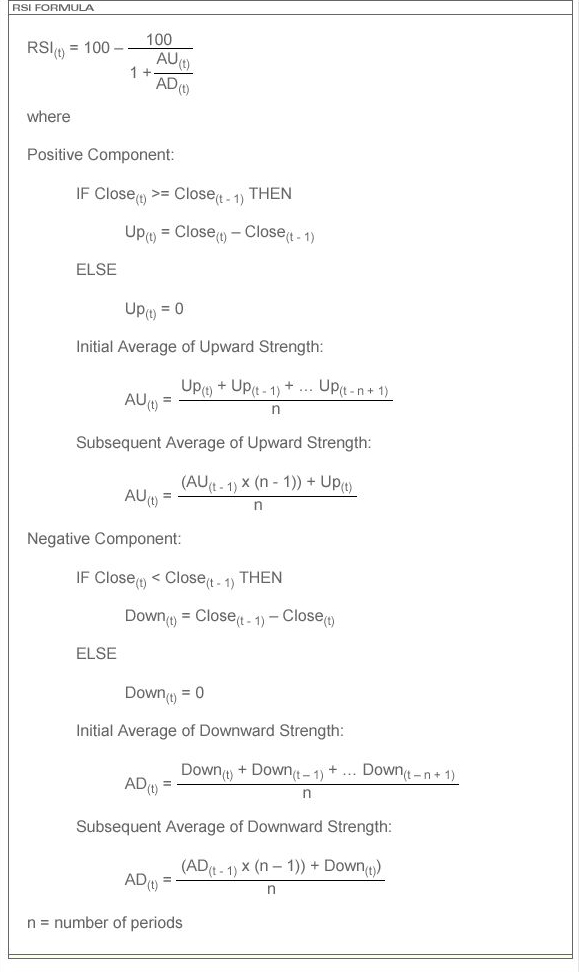
The Relative Strength Index (RSI), developed by Welles Wilder, is a special form of the Momentum indicator and measures an instrument’s internal strength compared to past prices. The calculation of the RSI takes a few of steps. First, positive closing prices (i.e. positive day change) and negative closing prices (i.e. negative day change) are added and then divided by the number of periods less one. The result is the period’s mean value of upward and downward strength of the underlying instrument. The relative strength is then derived from a ratio of the upward and downward mean.
The formula for the RSI is:
The RSI is a lower technical study. ProSticks uses a default parameter of 14 bars to calculate the RSI. 9, 11, and 25 bars are also commonly used.
The RSI fluctuates between the values of 0 to 100. A high RSI, readings over 70, suggests an overbought or weakening rally, but does not necessarily mean a top. Conversely, a low RSI, below 30, implies an oversold market or weakening sell-off, but does not necessarily imply a market bottom. A 50 reading can serve as a zero-line in other oscillators. Crossing the line from above or below can serve as a signal to enter the market.
Divergence can also be implied by the RSI. For example, the market makes new highs during a rally but the RSI fails to exceed its previous highs. This may indicate weakening of the rally.


