The Williams’ %R, developed by Larry Williams, is used to measure whether or not a security is overbought or oversold. The indicator is designed to show the relationship between the period high and the current close within the specified period. The %R is plotted on an upside down scale with 0 at the top and -100 at the bottom.
The formula for the %R is:
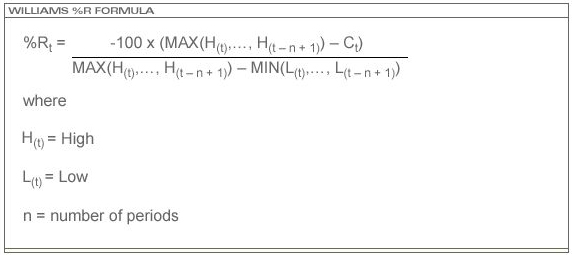
The Williams %R indicator is a lower technical study. ProSticks uses the default parameter of 10 bars to calculate Williams %R. 14 bars is also commonly used.
Traders usually consider values -20 or higher to be overbought and values -80 and under oversold. Note that the price can remain overbought, or oversold, for a long period of time even though the price continues to rise or fall.
ADVERTISEMENTS
