The Bollinger Bands, developed by John Bollinger, are effective in determining overbought and oversold conditions in the market. They consist of a Moving Average and two standard deviations plotted above and below the Moving Average. The line above is two standard deviations added to the Moving Average, whereas the line below is two standard deviations subtracted from the Moving Average. Since standard deviation measures volatility, the bands widen during volatile periods and contracts during calmer periods.
The formula for the Bollinger Bands is:
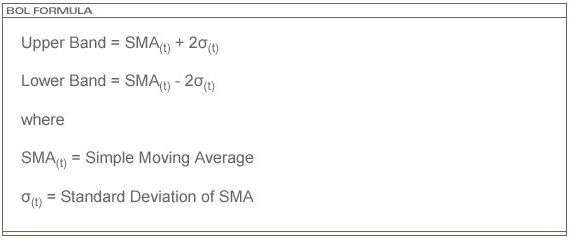
The Bollinger Bands is an upper technical study. ProSticks uses a default parameter value of 20 bars to calculate the Bollinger Bands. 14 and 21 bars are also commonly used.
Bollinger Bands are best used with other indicators for confirmation of buy and sell signals. Sharp price changes tend to occur after the bands tighten, after volatility lessens. When prices move outside the bands, a continuation of the current trend is implied. Bottoms and tops made outside the bands followed by bottoms and tops made inside the bands call for reversals in the trend. A move that originates at one band tends to go all the way to the other band. This observation is useful when projecting price targets.
