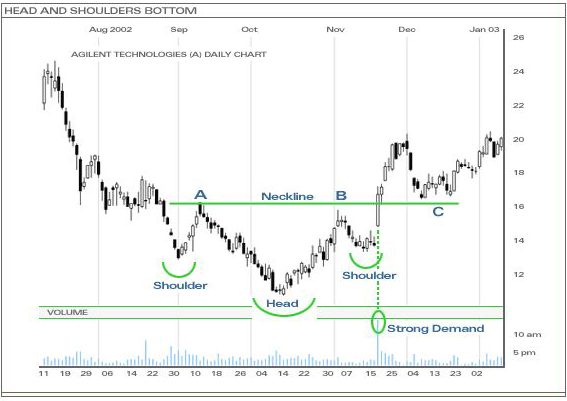
The head and shoulders bottom pattern follows a down-trending market and is a signal that marks a reversal in the current trend. As the name suggests, the pattern is made up of a left shoulder, a head, a right shoulder, and a neckline. Three successive troughs with the middle trough (head) being the deepest and the first and last troughs (left and right shoulder, respectively) being shallower, and approximately symmetrical, form the pattern. The resistance level (neckline) is determined by connecting the highs of each trough and once this level is broken, the head and shoulders bottom pattern is confirmed and indicates a new willingness of investors to buy at higher prices.
Volume serves as an even more important indicator for the head and shoulders bottom pattern than the head and shoulders top pattern. In most cases, volume levels during the decline of the left shoulder should be higher than the subsequent decline of the head. This decrease in volume along with new lows of the head can serve as a warning sign that a trend reversal could be in the horizon. A second warning sign may come with increasing volume levels on the rise from the peak of the head. Final signs of a reversal may come when the volume level further increases during the rise of the right shoulder.
And as with most patterns, once the resistance level is broken (the neckline in this case), it is this same resistance level that becomes a support point for future sell-offs.

In the above example, the price was in a down-trend and consolidated just before the drop that formed the left shoulder (point A). The price rallied to point A to form the beginning of the neckline and then declined for the next month to form the middle trough (head). It then began its reversal, rallying to point B before pulling back to form the right shoulder. Along the way, the second point of the neckline was formed, as well as the resistance, at point B. The price then rallied on strong volume, which is necessary for the head and shoulders bottom pattern, to pierce through the resistance level (neckline). Confirmation of the pattern resulted and the trend had indeed made its turn to the upside.
As seen from the above example, traders do not always have to chase a stock after the neckline breakout of the head and shoulders bottom pattern. Many times, but certainly not always, the price will return to this new support level and offer a second chance to buy (point C) before continuing its advance.

