In most cases, the symmetrical triangle is a continuation pattern that forms during a trend. The pattern contains at least two lower highs and two higher lows. When these points are connected in a trend line, the lines converge as they are extended and a symmetrical triangle will materialize.
In some cases, symmetrical triangles can be the beginning of an important trend reversal but more often than not, a continuation of the current trend is the result from the pattern. And as with all patterns, confirmation will only appear after a valid breakout.
As the symmetrical triangle forms itself and the trading range narrows, volume levels should be very weak and flat. The breakout, however, should occur with an increase in volume levels, especially for upside breakouts.
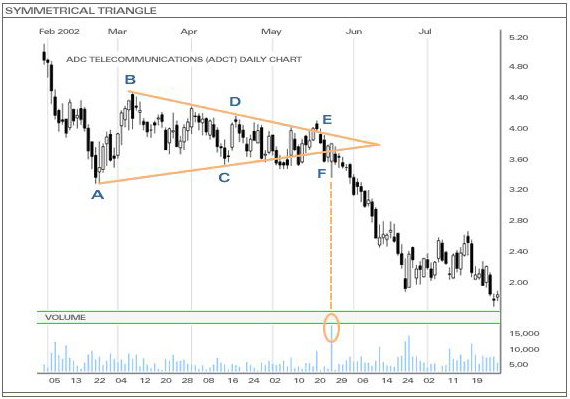
In the above example, a down-trend was in place when the price drifted into the symmetrical triangle at point A and the trading range began to contract. Trend lines were formed during the next two months (A-C and B-D). At point E, the price broke through the resistance trend line, pushing for a trend reversal, but failed right away. It was a false breakout. One should thus keep in mind that it is always better to wait for the day’s close to wait for the confirmation and see how bullish the breakout is and whether or not it is a good entry point. The following day, after point E, the price opened below the trend line and thus, confirmed the previous day’s signal as a false breakout. Subsequently, the price broke through the triangle at point F with strong volume accompanying the sell-off, which helps confirm the symmetrical triangle as a trend continuation pattern. In this case, a down-trend.
