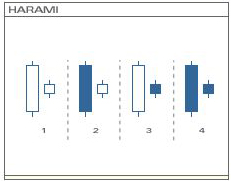
 Candlestick patterns that form within the body of the previous candlestick is call a Harami. Harami means pregnant in Japanese and the second candlestick is tucked inside the first. In most cases, the first candlestick has a much larger body than the second candlestick.
Whether a harami is bullish or bearish, they all have the same appearance. No matter what the color of the first candlestick, the smaller the body of the second candlestick, the greater is the chance for a reversal (e.g. doji, spinning top). In order to identify the bias of a harami, one must, as with other candlestick patterns, observe the preceding trend. Harami are considered potential bullish reversals after a decline, or down-trend, and potential bearish reversals after an advance, or up-trend.
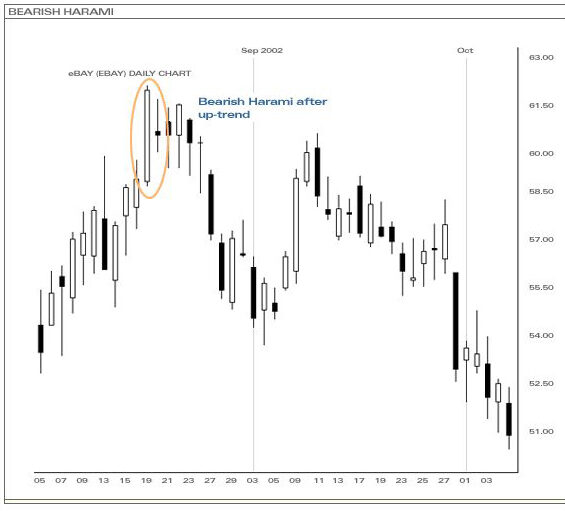
The above is an example of a bearish harami pattern. After an up-trend and a very bullish long white candlestick, a long-legged doji was formed, creating the harami formation with the previous day’s candlestick. Due to the prevailing up-trend at the time, the harami is thus considered to be a bearish harami. Subsequently, the price reversed and went on a decline during the next month of trading.
