A rectangle chart pattern is continuation pattern that forms in a consolidation, or trading range, period. The pattern can be identified by two highs that are about equal and two lows that are approximately equal, forming two horizontal lines (i.e. the top and bottom edges of a rectangle).
As with most formations, the rectangle chart pattern is not complete until a breakout has occurred. The direction of the breakout is usually not identifiable beforehand but volume levels can provide insight into the underlying structure and strength of the pattern. If volume contracts during the formation, an increase in volume afterwards may be a signal that a breakout is imminent. On the other hand, if volume fluctuates sporadically, then one should focus on the actual levels during a test of resistance, or support, to see which side, the bulls or the bears, has more support.
One should always keep in mind that a rectangle formation has a neutral bias as to which direction it will breakout to and that it is better to wait for a confirmation (i.e. a clear breakout) before positioning one’s portfolio.
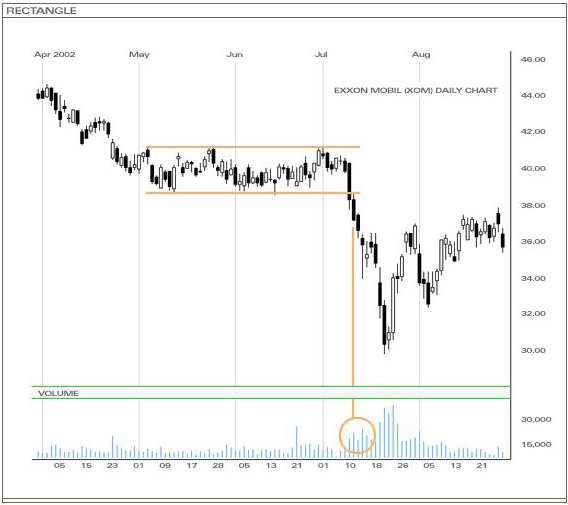
In the above example, the price was in a down-trend before forming the rectangle pattern in early May. The pattern looked as if it had formed a bottom. Volume was very light until it began to increase day-after-day in early July. This was a clear sign that a breakout was imminent and in this case, it was to the down-side, and thus, a continuation of the previous down-trend.
