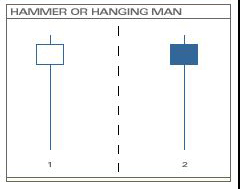
 The hammer and hanging man candlestick patterns both have the same appearance. The difference between them depends on the preceding price action. The formations are created when the price moves significantly lower intra-day after the open but rallies to close well off the low. The high should be near the open (for black candlesticks) or close (for white candlesticks) and, preferably, the length of the lower shadow should be three times that of the body. In some cases, there will be a short upper shadow.
In most cases, the price action of this formation indicates that the bears were mounting a huge sell-off during the day but there was not enough selling pressure to last the entire period as the bulls rallied and pushed the price back up by day’s end.
A hammer will result if the formation was created after a decline, or down-trend. The market is trying to hammer out a bottom. The signal indicates to the bulls that the bears are weakening and that a reversal may be on the horizon.
On the other hand, a hanging man will result if the formation was created after an advance, or up-trend. Even though there was a strong rally at day’s end, this formation should indicate potential weakness on the side of the bulls.
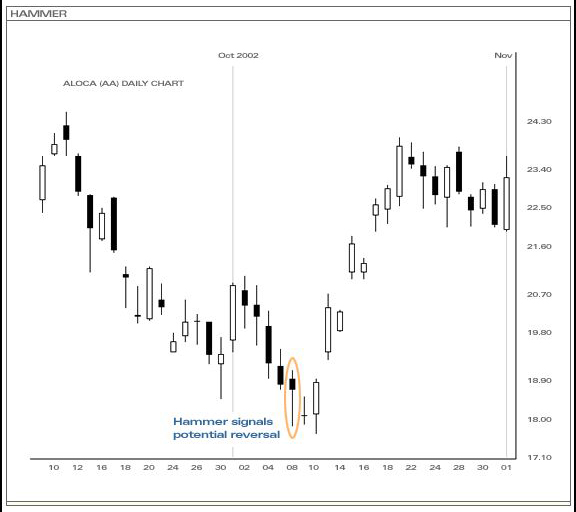
In the above example, the price was in a steep decline when a hammer pattern was formed signalling a potential reversal on the horizon. The next day, a doji helped confirm the weakness of the bears and the indecisiveness of the market. It also meant that the hammer the previous day was not a false signal. The price reversed course strongly following the doji signal.
