The head and shoulders top formation pattern is one of the most common reversal formations. The head and shoulders top formation pattern follows an up-trending market and is a signal that marks a reversal in the current trend. As the name suggests, the pattern is made up of a left shoulder, a head, a right shoulder, and a neckline. Three successive peaks with the middle peak (head) being the highest and the first and last peaks (left and right shoulder, respectively) being lower, and approximately symmetrical, form the pattern. The support level (neckline) is determined by connecting the lows of each peak and once this level is broken, the head and shoulders top pattern is confirmed and indicates a new willingness of investors to sell at lower prices.
Volume can serve as an important indicator for the head and shoulders pattern. In most cases, volume levels during the rise of the left shoulder should be higher than the subsequent rise of the head. This decrease in volume along with new highs of the head can serve as a warning sign that a trend reversal could be in the horizon. A second warning sign may come with increasing volume levels on the decline from the peak of the head. Final signs of a reversal may come when the volume level further increases during the decline of the right shoulder.
And as with most patterns, once the support level is broken (the neckline in this case), it is this same support level that becomes a resistance point for future price advances.
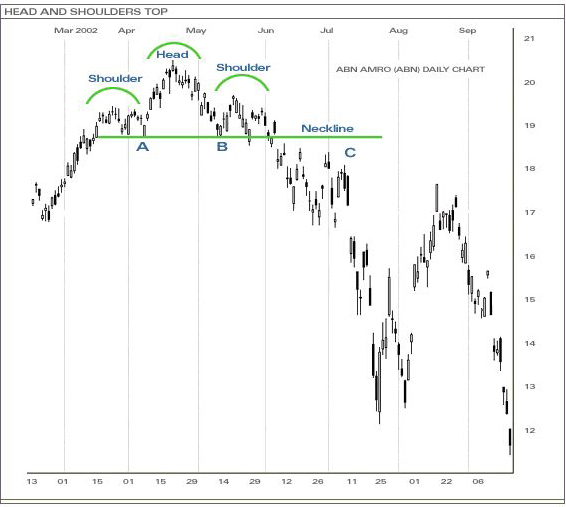
In the above example, the price was in an up-trend until it stumbled to point A, forming the left shoulder in the process. Also, point A formed the beginning of the neckline. The price then peaked and then weakened to point B, forming the head of the pattern along the way. The low of the head (point B) also formed the second point of the neckline and support level. The price, from point B, then rallied but lacked strength from the buyers and dropped back toward the neckline (forming the right shoulder). In the following days, it traded in a sideways pattern until the support was finally broken, confirming the head and shoulders top pattern and signaled that the bears had won the battle.
