The descending triangle is a bearish formation that usually forms during a down-trend and indicates distribution. In most cases, the formation is a continuation pattern with some instances of reversals at the end of an up-trend.
Two or more lows approximately equal to one another form a horizontal line at the bottom (lower support) and two or more highs, one lower than the previous one, form a descending trend line (upper resistance) that converges on the horizontal line as it declines.
As the pattern develops, volume levels usually lessen and are quite flat. This is simply a quiet period before the sell-off. When the break of support occurs, there should be an expansion of volume to confirm the breakout and continuation of the current down-trend (or reversal of the prevailing up-trend).
And as in most cases, once the support is broken, it transforms into a resistance level for future price movements. When the horizontal support line of the descending triangle is broken, it turns into resistance. Sometimes the price will re-test this resistance level before the downside move resumes.
In contrast to the symmetrical triangle where a breakout is needed to determine the bias of the market, a descending triangle pattern has a more definitive bearish bias due to the lower reaction highs as the formation extends to the right. It is these lower highs that indicate increased selling pressure and give the pattern its bearish bias.
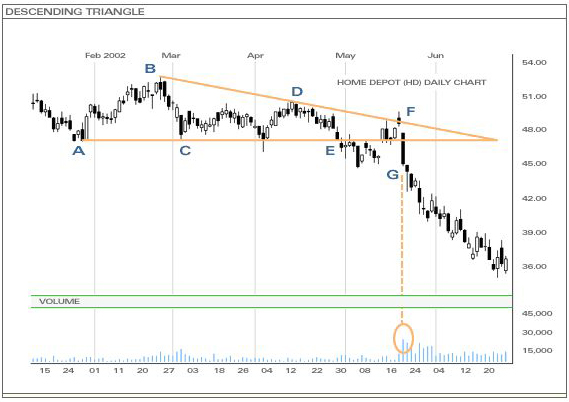
In the above example, the price was in a down-trend as it began to form the descending triangle pattern. The price, in a 4-month span, was not able to break support at points A, C, and E. Lower highs were formed from point B to points D and F, indicating distribution and bearishness. Volume was weak as expected during the formation and began to pick up at point F. The resistance trend line was too strong during the last test of resistance and the price finally retraced and broke through support at point G on heavy volume. The descending triangle formation had been confirmed and the price resumed its down-trend move.
